I recently had some trouble figuring out where exactly a program was
consing, so I wrote a quick hack for converting the SBCL statistical CPU profiler
to an allocation profiler
(patch against 0.9.12.22). Instead of getting
profiler ticks from the system itimer, the allocator will trigger a tick every
time it opens a new allocation region
(basically whenever 8kB have been allocated). To use
SB-SPROF in allocation profiling mode, just pass :ALLOC T to
WITH-PROFILING / START-PROFILING. Other than that, all SB-SPROF
functionality should work normally
(disassembler integration, call graphs, slime-sprof, etc).
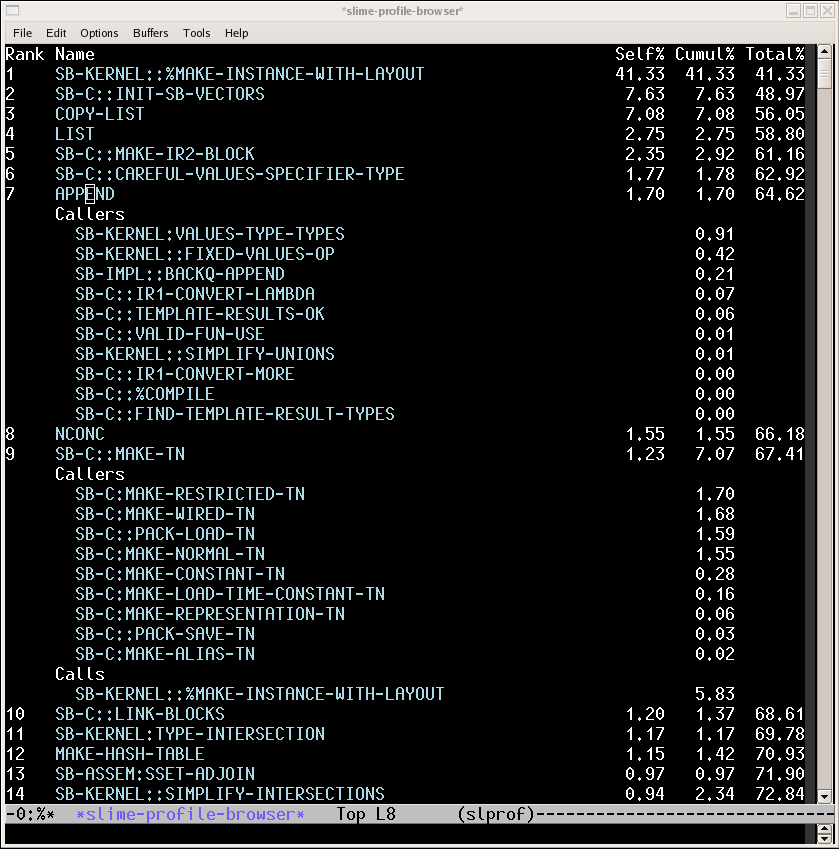
For example the following slime-sprof screenshot
(click on thumbnail for a larger image) shows that around 7% of the consing
during a profiling run was in SB-C:MAKE-TN or functions called from it,
0.91% was in APPEND when called from SB-KERNEL:VALUES-TYPE-TYPES, etc.
The patch isn't really committable as such. Since the functionality is not needed very often, I probably won't bother cleaning it up. But it might still be useful to someone even in this crude state, hence this post.
Not useful? This is incredibly useful!